
Hello again! For those of you familiar with my journey, you might remember that I begin each blog post with how I’m feeling, customary of the NYU Data Services appointment request form. I’ve gone from hopeful, to excited, and now, I’m thankfully feeling zen – with the added pressure of knowing I have work to get done, of course. Ever since I finally narrowed down the argument of my project, I’ve transitioned to a state of peacefulness – hence the new and improved title, “Access to interpretable data to support disproportionate health risks from industrial releases: A case study on the EPA’s datasets and their application to the Hispanic communities of Houston, Texas”.
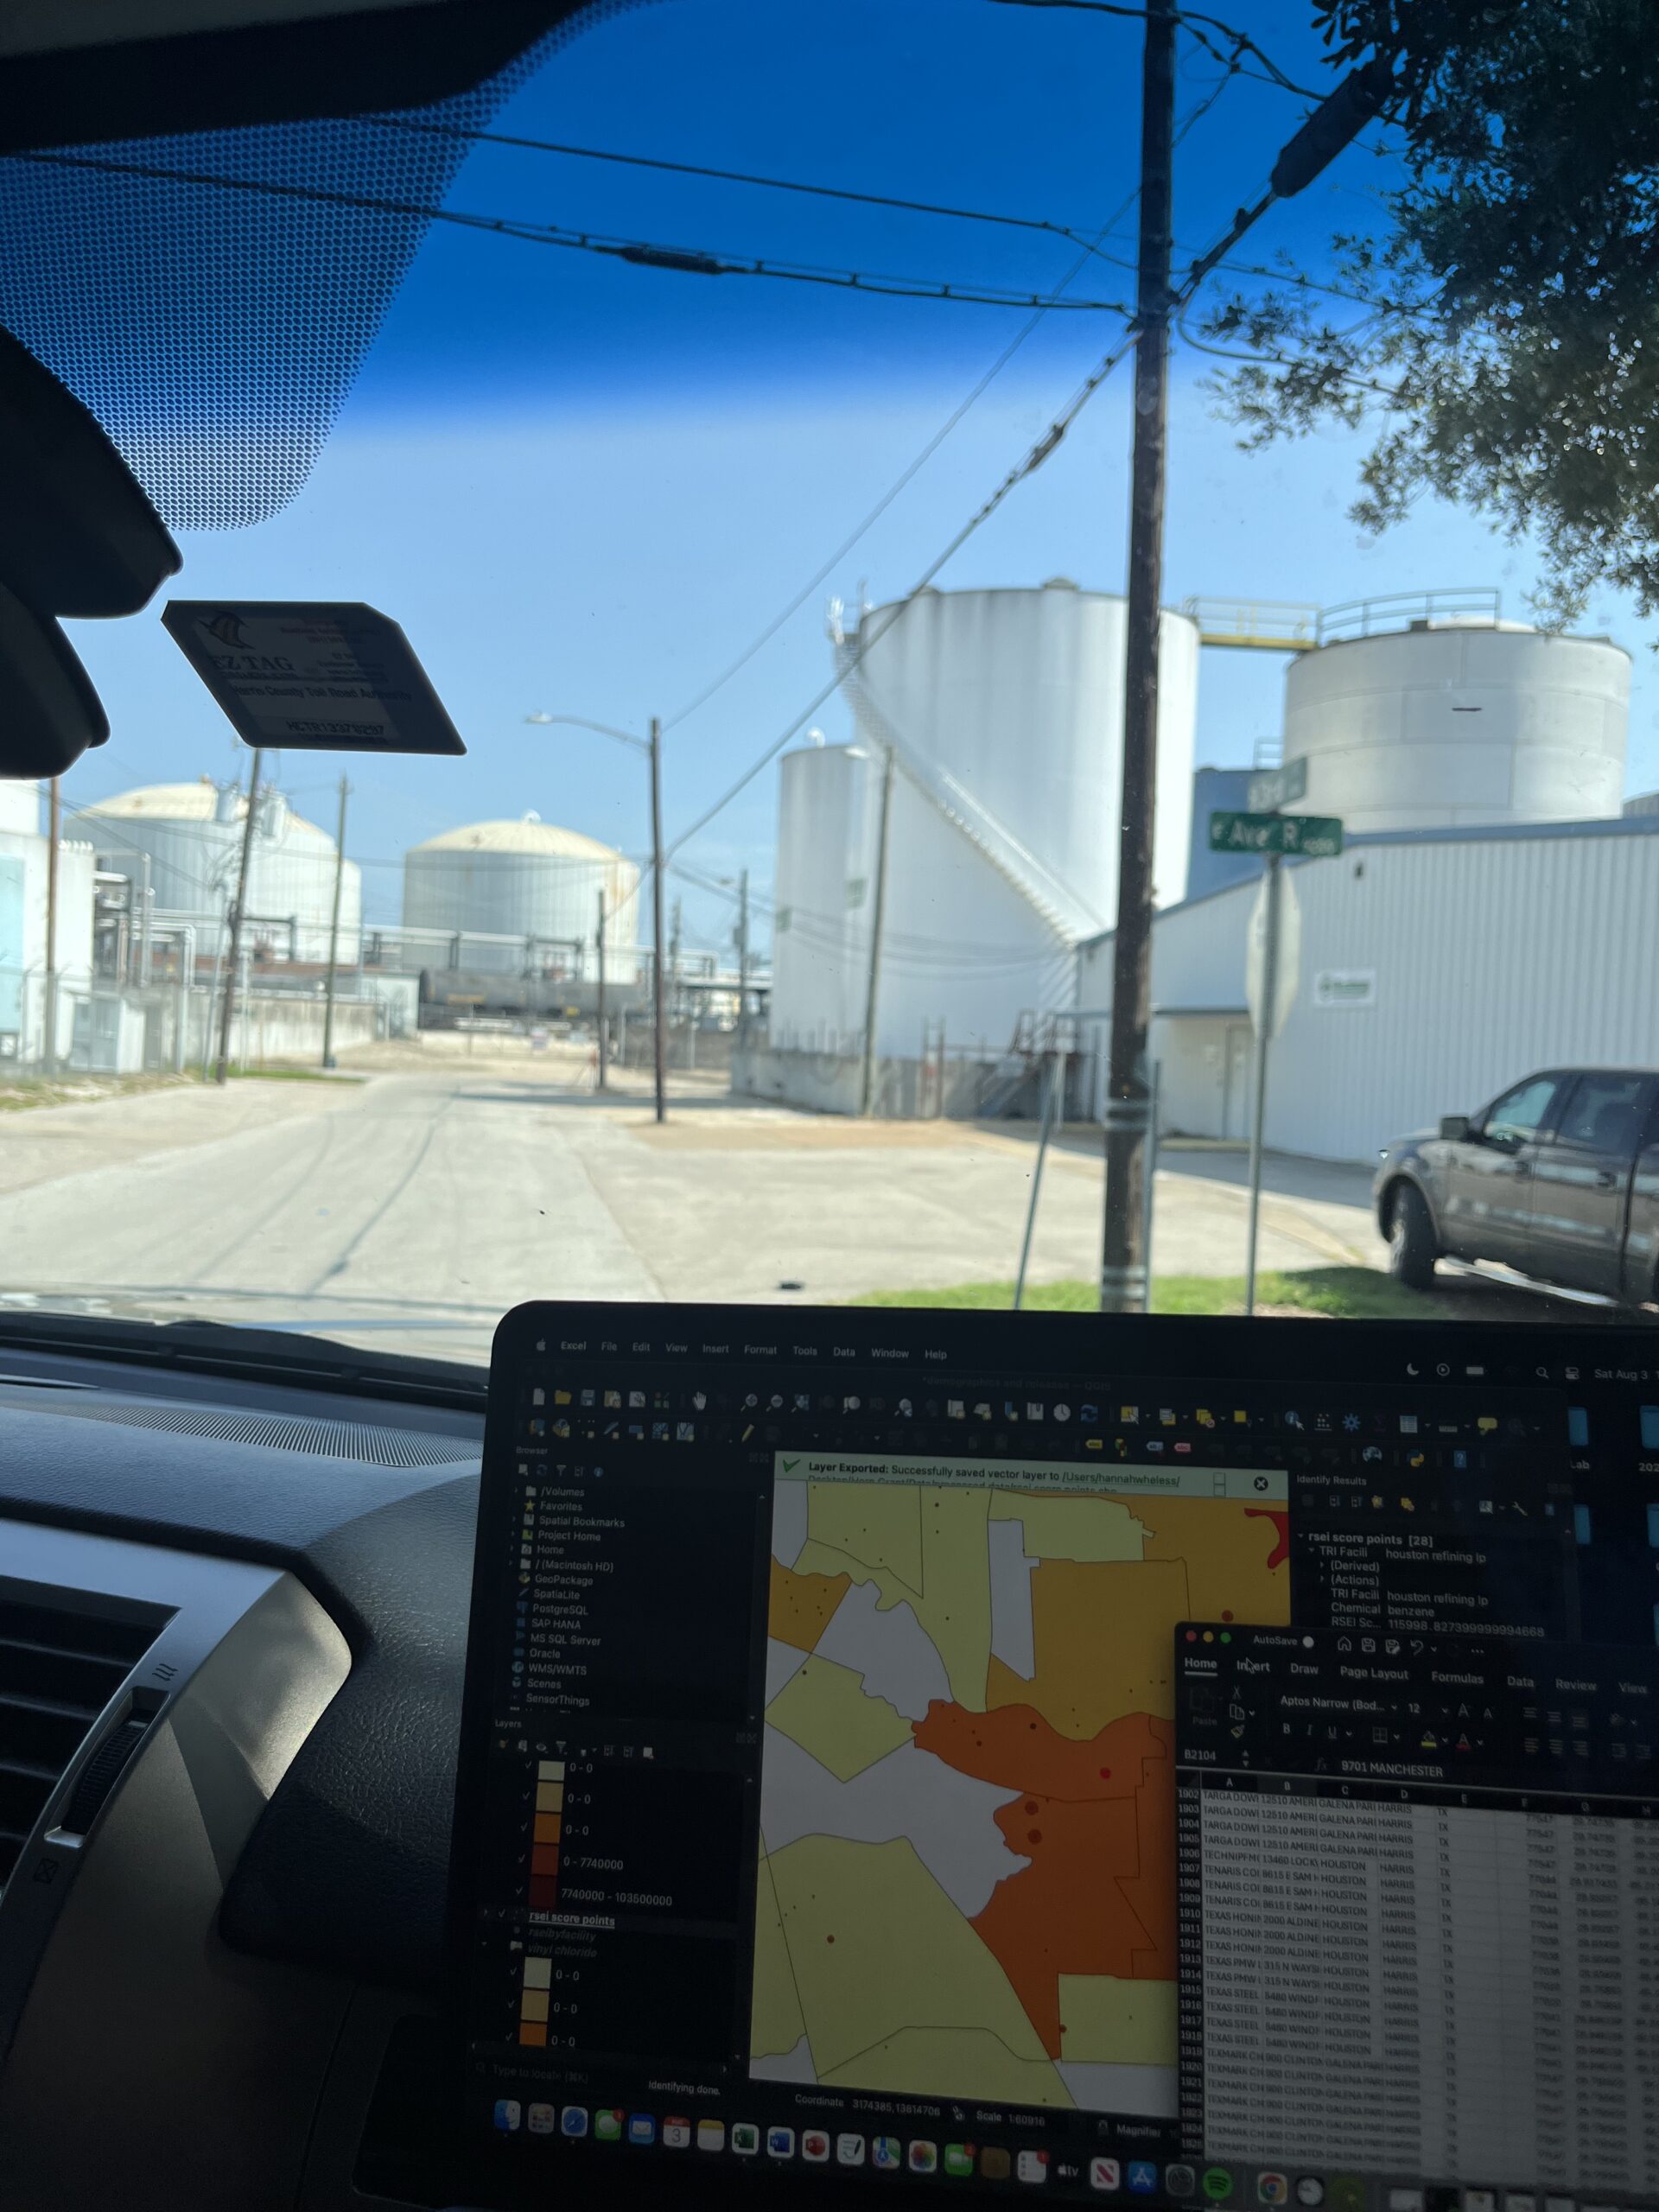
I was able to solidify this argument once I made an interesting realization. I had just finished mapping my EPA Toxic Release Inventory (TRI) data on industrial facilities’ chemical releases via stack and fugitive emissions (air pollution), leaving me with the sum of pounds of each chemical released annually by community. I then needed to figure out what these numbers meant in an environmental health context – like, how many pounds of benzene can one community take in a year before adverse health effects can be observed? And what would those health effects be?
There are resources such as CDC’s Agency for Toxic Substances and Disease Registry (ATSDR)’s Minimal Risk Levels, which is a list of estimated levels of the amount of a chemical a person can eat, drink, or breathe without a detectable risk to health. I figured that this would be a useful tool to compare to my chemical maps to see which communities might face specific chemical-related health issues. But these risk level lists give values in parts per million (ppm) or mg/m3, which cannot be converted or compared to values in pounds/year – the data I have.
I was put into quite the pickle after this recognizing this disconnect, but I then discovered the EPA’s Risk Screening Environmental Indictor (RSEI) model. This data provides scores for each chemical released by each industrial facility, with scores based on the quantity, toxicity, and methods of exposure of the chemicals. RSEI scores can be linearly related to one another, meaning that, for example, if the collective RSEI score for one community is 1, and the collective RSEI score for another community is 10, the second community is 10 times more at risk to face adverse health effects compared to the first. Although this somewhat solves my issue with quantifying health risks from industrial releases, this model doesn’t give me exact information on the chances of a population facing specific adverse health effects from such chronic exposures to these levels of pollution.
Despite the fact that these resources from the EPA, the TRI and the RSEI, are supposed to be the most comprehensive databases for industrial chemical releases, this resource has multiple short comings that make it difficult to link such exposures to public health concerns – in particular for the communities impacted by this issue the most, such as the Hispanic communities in Houston. This is an especially important issue to examine as environmental justice policy changes often require sound data evidence.
I don’t want to spoil too much too soon, so you’ll have to read my final research paper or related articles I’ve written to find out more. Thanks to all who’ve followed the progress of this project – I hope you’ll be hearing from me soon!